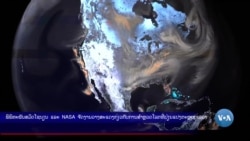
ຫໍພິພິທະພັນປະຫວັດສາດທຳມະຊາດແຫ່ງຊາດ ສມິດໂຊນຽນ ໄດ້ເປີດ "ສູນລວມຂໍ້ມູນໂລກຂອງອົງການນາຊາ (NASA)" ເຊິ່ງແມ່ນງານວາງສະແດງ ທີ່ຈະໃຫ້ຜູ້ເຂົ້າຮ່ວມໄດ້ເຫັນພະລັງທີ່ສ້າງໂລກຂອງເຮົາດ້ວຍຕົນເອງ. ທ່ານ ແອນດຣູ ເຊີຍຄາຊ ລາຍງານ, ເຊິ່ງພວກເຮົາຈະນຳເອົາລາຍລະອຽດມາສະເໜີທ່ານໃນອັນດັບຕໍ່ໄປ.
ນີ້ແມ່ນໄຮເປີ້ວໍ... ໜ້າຈໍຂະໜາດ 10 ຄູນ 3 ແມັດ ຂອງງານວາງສະແດງໃໝ່ຢູ່ ທີ່ພິພິທະພັນປະຫວັດສາດທຳມະຊາດແຫ່ງຊາດ ສມິດໂຊນຽນ ໃນນະຄອນຫຼວງ ວໍຊິງຕັນ.
ງານວາງສະແດງນີ້ມີຊື່ວ່າ "ສູນລວມຂໍ້ມູນໂລກຂອງອົງການນາຊາ (NASA)" ເຈົ້າໜ້າທີ່ອົງການ ນາຊາ ທີ່ເຮັດວຽກໃນໂຄງການນີ້ກ່າວວ່າ ເປັນນຶ່ງໃນວິທີທີ່ດີທີ່ສຸດ ໃນການຮຽນຮູ້ກ່ຽວກັບການປ່ຽນແປງທີ່ເກີດຂຶ້ນເທິງໂລກຂອງພວກເຮົາ ໂດຍການຕີຄວາມໝາຍດ້ວຍພາບ.
ທ່ານນາງ ແຄເຣັນ ເຊັນ ເຈີເມັນ, ຜູ້ອຳນວຍການພະແນກວິທະຍາສາດໂລກຂອງອົງການ NASA:
"ການສະແດງພາບແທ້ໆ ສາມາດນຳມາເຊິ່ງຄວາມເຂົ້າໃຈທີ່ເລິກເຊິ່ງ ກ່ຽວກັບ ສິ່ງທີ່ເຮົາເຫັນຈາກອາວະກາດຫຼາຍກວ່າບົດລາຍງານ. ນັ້ນແມ່ນເຫດຜົນທີ່ເຮົາ ໃຊ້ເຄື່ອງມືນີ້."
ໄຮເປີ້ວໍ ສະທ້ອນໃຫ້ເຫັນການປ່ຽນແປງທີ່ເກີດຂຶ້ນເທິງໂລກ. ມັນສະແດງຂໍ້ມູນ ຈຳນວນມະຫາສານ-ສາມາດສະແດງວ່າຄາບອນໄດອົກໄຊມີຄວາມເຂັ້ມຂຸ້ນສູງ ສຸດຢູ່ບ່ອນໃດເທິງໂລກ ແລະ ຕິດຕາມການເຄື່ອນໄຫວຂອງມົນລະພິດທາງແສງ ແລະ ສຽງ ເທິງໂລກ. ດາວທຽມ 25 ດວງ ແລະ ເຊັນເຊີເທິງພື້ນດິນຈຳນວນ ຫຼາຍເກັບກຳຂໍ້ມູນທີ່ ນາຊາ ແບ່ງປັນໃຫ້ກັບຜູ້ເຂົ້າຊົມ.
ທ່ານ ເຄີກ ຈອນສັນ, ຜູ້ອຳນວຍການຫໍພິພິທະພັນປະຫວັດສາດທຳມະຊາດແຫ່ງຊາດ ສມິດໂຊນຽນ:
"ເຮົາກຳລັງໄດ້ຮັບຂໍ້ມູນແບບໃນເວລາຈິງ (real-time) ທີ່ສະສົມຂຶ້ນ ແລະ ເຮົາເຫັນ ຮູບແບບໄລຍະຍາວ, ຕອນນີ້ເຮົາກຳລັງເຫັນເສັ້ນໂຄ້ງ ຄີວລິງ (Keeling), ເຊິ່ງເປັນ ເສັ້ນໂຄ້ງທີ່ສະແດງປະລິມານຂອງຄາບອນໄດອົກໄຊ ໃນຊັ້ນບັນຍາກາດຕະຫຼອດ 64 ປີທີ່ຜ່ານມາ, ແລະ ມັນເປັນນຶ່ງໃນເສັ້ນໂຄ້ງທີ່ໜ້າສົນໃຈທີ່ສຸດໃນວິທະຍາສາດ!"
ການສະແດງພາບທີ່ຫຼາກຫຼາຍນີ້ ບໍ່ພຽງແຕ່ເຮັດໃຫ້ຜູ້ເຂົ້າຊົມຮູ້ສຶກປະຫຼາດໃຈ, ແຕ່ຍັງລວມເຖິງນັກວິທະຍາສາດທີ່ມີປະສົບການທີ່ຄຸ້ນເຄີຍກັບຂໍ້ມູນຈຳນວນຫຼາຍຕ້ອງປະຫຼາດໃຈອີກດ້ວຍ.
ທ່ານນາງ ແຄເຣັນ ເຊັນ ເຈີເມັນ ຈາກອົງການ NASA ກ່າວອີກຄັ້ງ:
"ນຶ່ງໃນການສະແດງພາບທີ່ຂ້ອຍມັກທີ່ສຸດແມ່ນພາບທີ່ສະແດງໃຫ້ເຫັນກະແສນ້ຳ ໃນມະຫາສະໝຸດທັງໝົດ ແລະ ມີການໃຊ້ລະຫັດສີ-ສະແດງອຸນຫະພູມ. ນັ້ນເປັນ ເພາະເຮົາເປັນດາວເຄາະແຫ່ງມະຫາສະໝຸດ. ມະຫາສະໝຸດທີ່ເກັບພະລັງງານສ່ວນ ໃຫຍ່ທີ່ມາຈາກດວງຕາເວັນ, ແລະ ກະແສນ້ຳທີ່ເຄື່ອນໄຫວຊ້າເຫຼົ່ານັ້ນ ເຄື່ອນຍ້າຍ ຄວາມຮ້ອນໄປທົ່ວໂລກ ແລະ ນັ້ນແມ່ນສິ່ງທີ່ເຮັດໃຫ້ຊີວິດເທິງໂລກນີ້ເປັນໄປໄດ້!"
ທ່ານ ບິວ ແນວສັນ ຜູ້ບໍລິຫານຂອງອົງການ ນາຊາ, ເຊິ່ງເຄີຍບິນໄປກັບໂຄງການ ຍານອາວະກາດ ໂຄລຳເບຍ (Columbia) ໃນປີ 1986 ກ່າວວ່າ ໂຄງການເຊັ່ນນີ້ ມີຄຸນຄ່າທາງການສຶກສາຢ່າງຫຼວງຫຼາຍ ແລະ ຫວັງວ່າ ຈະສ້າງແຮງບັນດານໃຈ ໃຫ້ຜູ້ເຂົ້າຊົມໄດ້ຮັບຮູ້ເຖິງບົດບາດຂອງພວກເຂົາໃນການດູແລຮັກສາໂລກ.
ທ່ານ ບີລ ແນລສັນ (Bill Nelson), ຜູ້ບໍລິຫານອົງການ NASA:
"ທຸກຄົນຢູ່ເທິງໂລກສາມາດກາຍເປັນຜູ້ຮ່ວມດູແລຮັກສາສິ່ງທີ່ສວຍງາມ ແລະ ມີສີສັນນີ້, ເຊິ່ງຫ້ອຍຢູ່ທາງກາງຂອງຄວາມຫວ່າງເປົ່າ ແລະ ນັ້ນແມ່ນໂລກຂອງ ພວກເຮົາ."
ງານວາງສະແດງນີ້ຈະເປີດໃຫ້ປະຊາຊົນເຂົ້າຊົມໄດ້ຈົນຮອດປີ 2028.
ອ່ານບົດລາຍງານດ້ານລຸ່ມນີ້ເປັນພາສາອັງກິດ
This month, [October 8] the Smithsonian National Museum of Natural History opened "NASA’s Earth Information Center" an exhibition that gives visitors a firsthand look at the forces shaping our planet. Andrei Dziarkach has the story, narrated by Anna Rice.
This is the hyperwall ... the ten-by-three meter focus of a new exhibit at the Smithsonian National Museum of Natural History in Washington.
The exhibit is called "NASA’s Earth Information Center." The NASA staff members who worked on it say that one of the best ways to learn about the changes taking place on Earth is to interpret them visually.
Karen St. Germain, NASA Earth Science Division.
"Visualizations really can bring a much deeper understanding of what we’re seeing from space than a report can. So, that’s why we’re using this tool.”
The hyperwall reflects changes as they occur on Earth. It displays an astounding amount of data — it can show where exactly on Earth carbon dioxide is concentrated in the highest quantities and track the dynamics of light and noise pollution on the planet. Twenty-five satellites and numerous land-based sensors collect the information that NASA shares with visitors.
Kirk Johnson, Smithsonian National Museum of Natural History.
“We’re getting real-time data that accumulates, and we see long-term patterns. // Right now, we’re seeing the Keeling Curve, which is the curve that shows the amount of carbon dioxide in the atmosphere over the last 64 years, and it’s one of the most compelling curves in science!”
The multiple visualizations amaze not just visitors but seasoned scientists as well, who are accustomed to oceans of data.
Karen St. Germain, NASA Earth Science Division.
“One of my favorite visualizations is the one that shows all of the ocean currents, and it’s color-coded with temperature. And that’s because we’re an ocean planet. Oceans store the vast majority of the energy that comes in from the sun, and those slow meandering currents move that heat all around the planet. And that’s what makes life possible on Earth !”
NASA Administrator Bill Nelson, who flew aboard the Columbia space shuttle program in 1986, says projects like this one have immense educational value and hopefully inspire visitors to recognize their role in taking care of the planet.
Bill Nelson, NASA Administrator.
“Everyone on planet Earth can become co-stewards of preserving this beautiful, colorful creation that is suspended in the middle of nothing, and that is planet Earth.”
The exhibit will be open to the public until 2028.


ຟໍຣັມສະແດງຄວາມຄິດເຫັນ